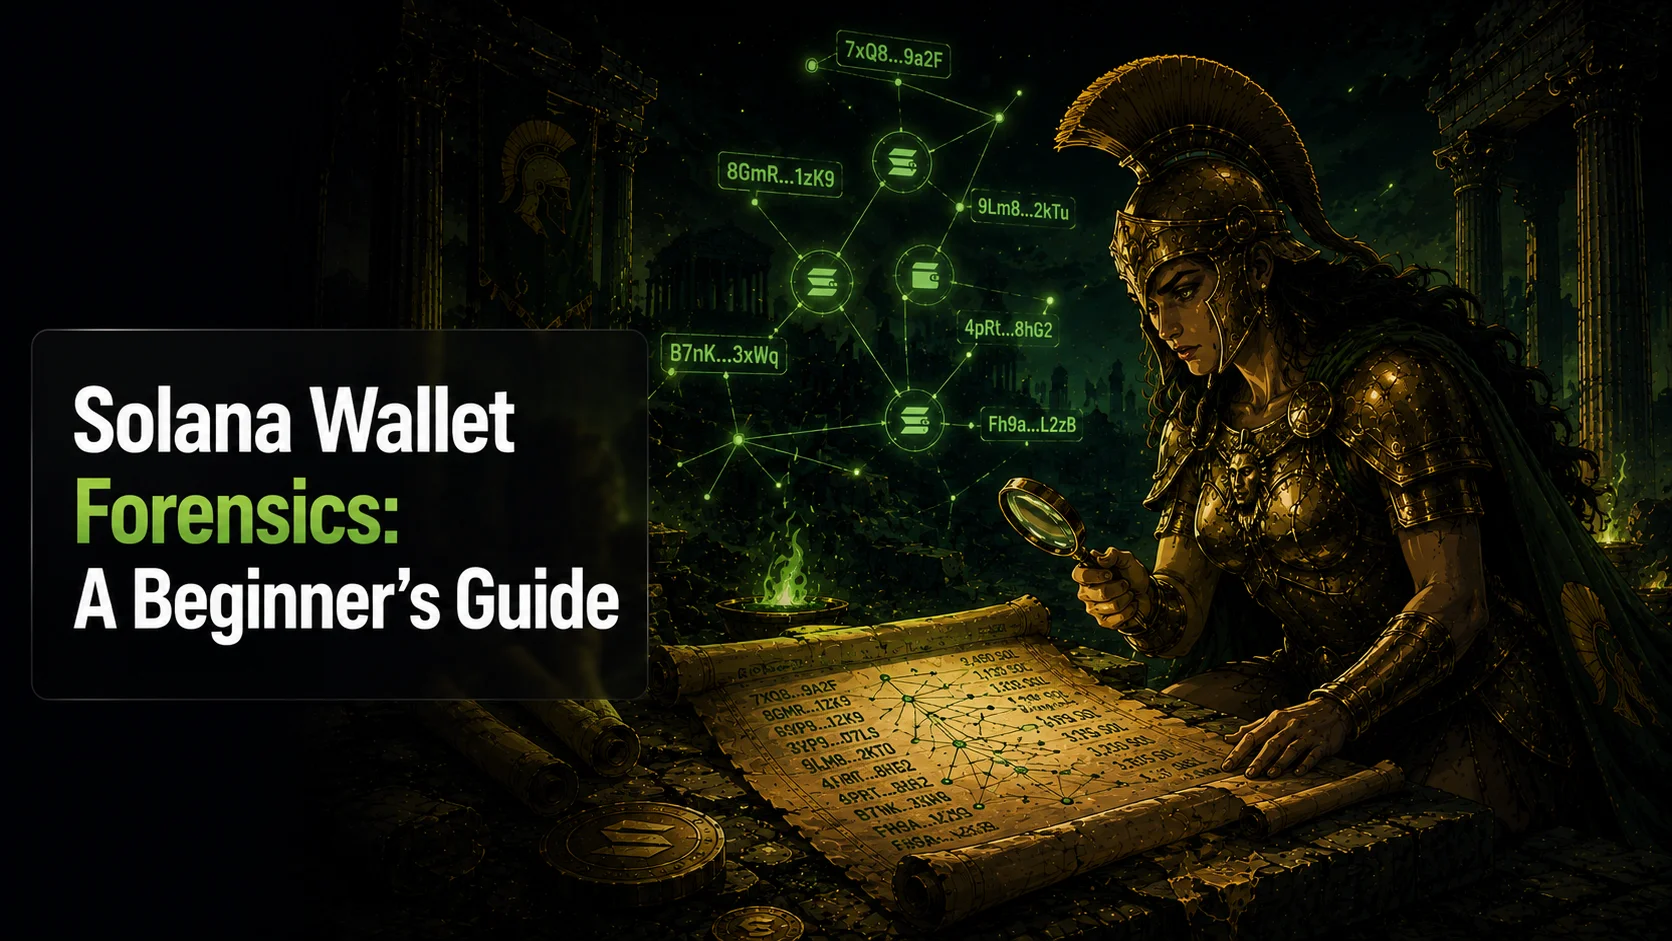
Wallet forensics is the art of tracing on-chain activity to uncover relationships between wallets, identify insider behavior, and assess the risk profile of a token's holder base.
Why Wallet Forensics Matters
Most retail traders look at price and volume. Smart traders look at who's holding and how they're behaving. The difference in insight is enormous.
A token might look healthy on the surface (good volume, rising price) but wallet analysis might reveal:
—The top 5 holders control 80% of the supply
—The deployer funded 20 new wallets to appear as organic holders
—A known sniper bot cluster is holding a significant position
Clustering
The core technique in wallet forensics is clustering, grouping wallets that likely belong to the same entity.
Common clustering signals:
—Funding source: wallets funded from the same source wallet
—Interaction patterns: wallets that interact with the same contracts in the same block
—Timing: wallets created in the same block or block range
—Value transfer: direct transfers between wallets
Fresh Wallets, Phishing and Insiders
These metrics tell you how healthy the holder base really is. Below 15% is favourable.
Fresh wallets indicate low holder quality. These are mostly side wallets of bundlers which they can dump at any time. Good holder quality is crucial. If you see whale, shark, or fish in the top 10, it's a good sign. These are wallets with history and balance, so the trust score goes up.
Holder Quality
Good holder quality means wallets with proven on-chain history, significant balances, and organic behaviour. At a minimum, a holder quality fish ratio of 0.25 or higher is desirable.
Bundler Percentage and Top 10%
These two are the most essential stats. Below 20% is favourable.
Bundler percentage shows how much of the supply was bundled at launch. Top 10% shows how much the top 10 holders control. High numbers mean high concentration risk.
Dev Wallet Behaviour
The dev wallet is the most important wallet to watch. Key things to check:
—Did the dev keep tokens at launch? How many? Over 5% is a yellow flag, over 10% is a red flag.
—Has the dev wallet sold before? Pull the on-chain history. Serial ruggers follow patterns.
—Is the dev wallet active post-launch? A dev who goes silent immediately after launch is a bad sign.
—Does the dev have a track record? Some devs have launched 10+ successful tokens. Others have 10+ rugs.
Insider Detection
Insider activity typically appears as:
—Wallets that bought before the first DEX listing
—Wallets that received tokens directly from the deployer
—Wallets that trade exclusively on one side of the market
—Wash trading between clustered wallets
Liquidity and Market Cap Ratio
The liquidity-to-market cap ratio tells you how easily the token can absorb sells. A healthy token has liquidity that is at least 5 to 10% of its market cap.
If a token has a $500k market cap but only $10k in liquidity, a single medium-sized sell will crater the price. This is often by design. The dev wants to maximise slippage and price impact when you try to exit.
Always check: if liquidity is thin relative to market cap, size down or skip entirely.
Reading the Chart Like a Trencher
In memecoins, you're not looking at RSI or moving averages. You're looking for different signals:
—Initial pump and hold: After the launch pump, does the price stabilise at a higher base? That's organic buying pressure holding the line.
—Volume trend: Is volume declining as the price holds? That could mean distribution. Is volume picking up as price consolidates? That's accumulation.
—Retrace depth: A healthy retrace is 30 to 50% from the peak. A 70 to 80% retrace usually means it's not coming back.
—Time on chart: Tokens that survive 24 to 48 hours with sustained activity have a much higher chance of a second leg up.
Most memecoins die in the first 30 minutes. The ones that survive are worth watching.
Applied Forensic Analysis
When evaluating a token, walk through these steps:
1.Check the deployer wallet's full history
2.Identify all wallets funded by the deployer
3.Look for clustering among top holders
4.Analyze trade timing for coordinated activity
5.Check if any clustered wallets have participated in previous rug pulls
Athena Alpha automates all five steps, presenting a complete forensic profile in under 30 seconds.